데이터를 시각화 해주는 차트 라이브러로 js, angular, vue, react에서도 사용 가능하다.
선 그래프, 거품형, 타임라인, 히트맵까지 다양한 스타일들이 있고, 반응형에 커스텀 기능까지 구현되어 있다.
* ApexCharts 사이트 *
https://apexcharts.com/
1. 라이브러리 다운
npm install --save react-apexcharts apexcharts
2. Chart 예시
import Chart from "react-apexcharts";


function App() {
  return (
	<ApexChart
          type="line"
          series= {[
           	 { name: "Price", data:[1000, 2000, 3000]},
		 { name: "Price2", data:[1500, 1000, 2500]},
          ]}
          options={{
            theme: { mode: "dark" },
            chart: {
              height: 300,
              width: 500,
              toolbar: { show: false },
              background: "transparent",
            },
            stroke: { curve: "smooth", width: 4 },
            grid: { show: false },
            yaxis: { show: false },
            xaxis: {
              labels: { show: false },
              axisTicks: { show: false },
              axisBorder: { show: false },
              categories: [1660004640, 1660091040, 1660177440],
              type: "datetime",
            },
            fill: {
              type: "gradient",
              gradient: { gradientToColors: ["blue"], stops: [0, 100] },
            },
            colors: ["red"],
            tooltip: {
              y: { formatter: (value) => `$ ${value.toFixed(2)}` },
            },
          }}
        />
  );
}

export default App;- type : 원하는 차트 선택 (선 그래프, 막대 그래프 등)
- options : https://apexcharts.com/docs/installation/ 원하는 style 설정 가능
- series : 보여주고 싶은 data
3. Chart Option
3-1) 테마 설정
theme: { mode: "dark" }- mode : 테마 설정
3-2) 차트 설정
chart: {
height: 300,
width: 500,
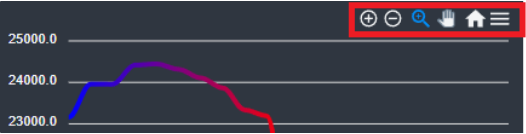
toolbar: { show: false },
background: "transparent",
}- height: 차트 높이 설정
- width : 차트 넓이 설정
- background : 차트 배경 색상
- toolbar : 툴바 on/off 설정 (확대, 축소, 다운로드 등 기능이 있다)background : 차트 배경 색상
3-3) 그래프 설정
stroke: { curve: "smooth", width: 4 }- curve : 그래프 꺽임 설정
- width : 그래프 두께 설정
3-4) 그리드 설정
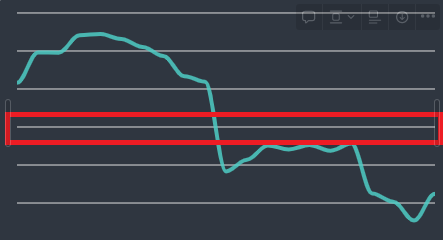
grid: { show: false }- show : 그리드 on/off 설정
3-5) Y축 범례 설정
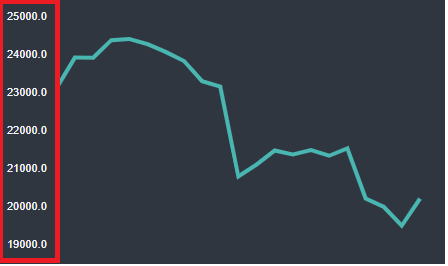
yaxis: { show: false }- show : 범례 on/off 설정
3-6) X축 범례 설정
xaxis: {
  labels: { show: false },
  axisTicks: { show: false },
  axisBorder: { show: false },
	categories: ["1660004640", "1660091040", "1660177440" ...],
	type: "datetime",
}- labels : 라벨 on/off 설정

- axisTicks : scale(규모) 눈금선 on/off 설정

- axisBorder : 경계 부분 on/off 설정

- categories : 범례 이름 설정

- type : 카테고리가 타입 설정
- datetime 적용
4. 그라데이션 설정
fill: {
  type: "gradient",
  gradient: { gradientToColors: ["blue"], stops: [0, 100] },
},
colors: ["red"]- gradientToColors : 끝나는 색상
- colors : 시작 색상
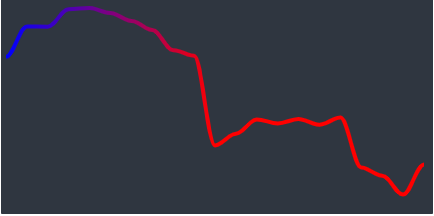
- stops : 시작 0, 끝 100으로 설정해서 그라데이션 비율 조절
5. 툴팁 설정
tooltip: {
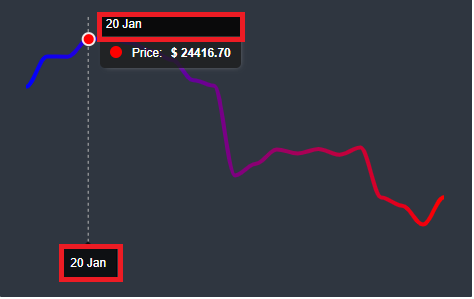
y: { formatter: (value) => `$ ${value.toFixed(2)}` },
}- y : y축에 관한 툴팁 옵션
- formatter : 데이터 format

6. Code 예시
import { useQuery } from "react-query";
import { useOutletContext } from "react-router";
import { fetchCoinHistory } from "../api";
import ApexChart from "react-apexcharts";

interface ChartProps {
  coinId: string;
}
interface IHistorical {
  time_open: string;
  time_close: string;
  high: number;
  open: number;
  low: number;
  close: number;
  volume: number;
  market_cap: number;
}

function Chart() {
  const { coinId } = useOutletContext<ChartProps>();
  const { isLoading, data } = useQuery<IHistorical[]>(["ohlcv", coinId], () =>
    fetchCoinHistory(coinId)
  );
  return (
    <div>
      {isLoading ? (
        "Loading chart..."
      ) : (
        <ApexChart
          type="line"
          series={[
            { name: "Price", data: data?.map((price) => price.close) ?? [] },
          ]}
          options={{
            theme: { mode: "dark" },
            chart: {
              height: 300,
              width: 500,
              toolbar: { show: false },
              background: "transparent",
            },
            stroke: { curve: "smooth", width: 4 },
            grid: { show: false },
            yaxis: { show: false },
            xaxis: {
              labels: { show: false },
              axisTicks: { show: false },
              axisBorder: { show: false },
              categories: data?.map((price) => price.time_close) ?? [],
              type: "datetime",
            },
            fill: {
              type: "gradient",
              gradient: { gradientToColors: ["#0be881"], stops: [0, 100] },
            },
            colors: ["#0fbcf9"],
            tooltip: {
              y: { formatter: (value) => `$ ${value.toFixed(2)}` },
            },
          }}
        />
      )}
    </div>
  );
}

export default Chart;- series data[]는 number 타입이지만 data?.map()으로 읽어 오게되면 number이지만 못 읽어오는 경우(undefind)가 되는 문제가 발생할 수 있기 때문에 null 병합 연산자로 처리해 주어야한다.
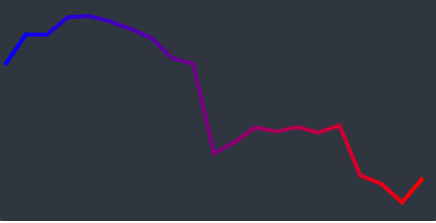
반응형
'React' 카테고리의 다른 글
| [ReactTS] Recoil State(상태) 관리 (0) | 2022.09.14 |
|---|---|
| [React] React Hook Form 사용한 Validation(검증) 처리 방법 (0) | 2022.09.06 |
| [ReacTS] React Query를 이용한 API 통신(useQuery, useQueries) (0) | 2022.08.25 |
| [React] Nested Router (중첩 라우터) (1) | 2022.08.24 |
| [React] React CSS 셋업 방법(CSS reset, Font 적용) (0) | 2022.08.21 |